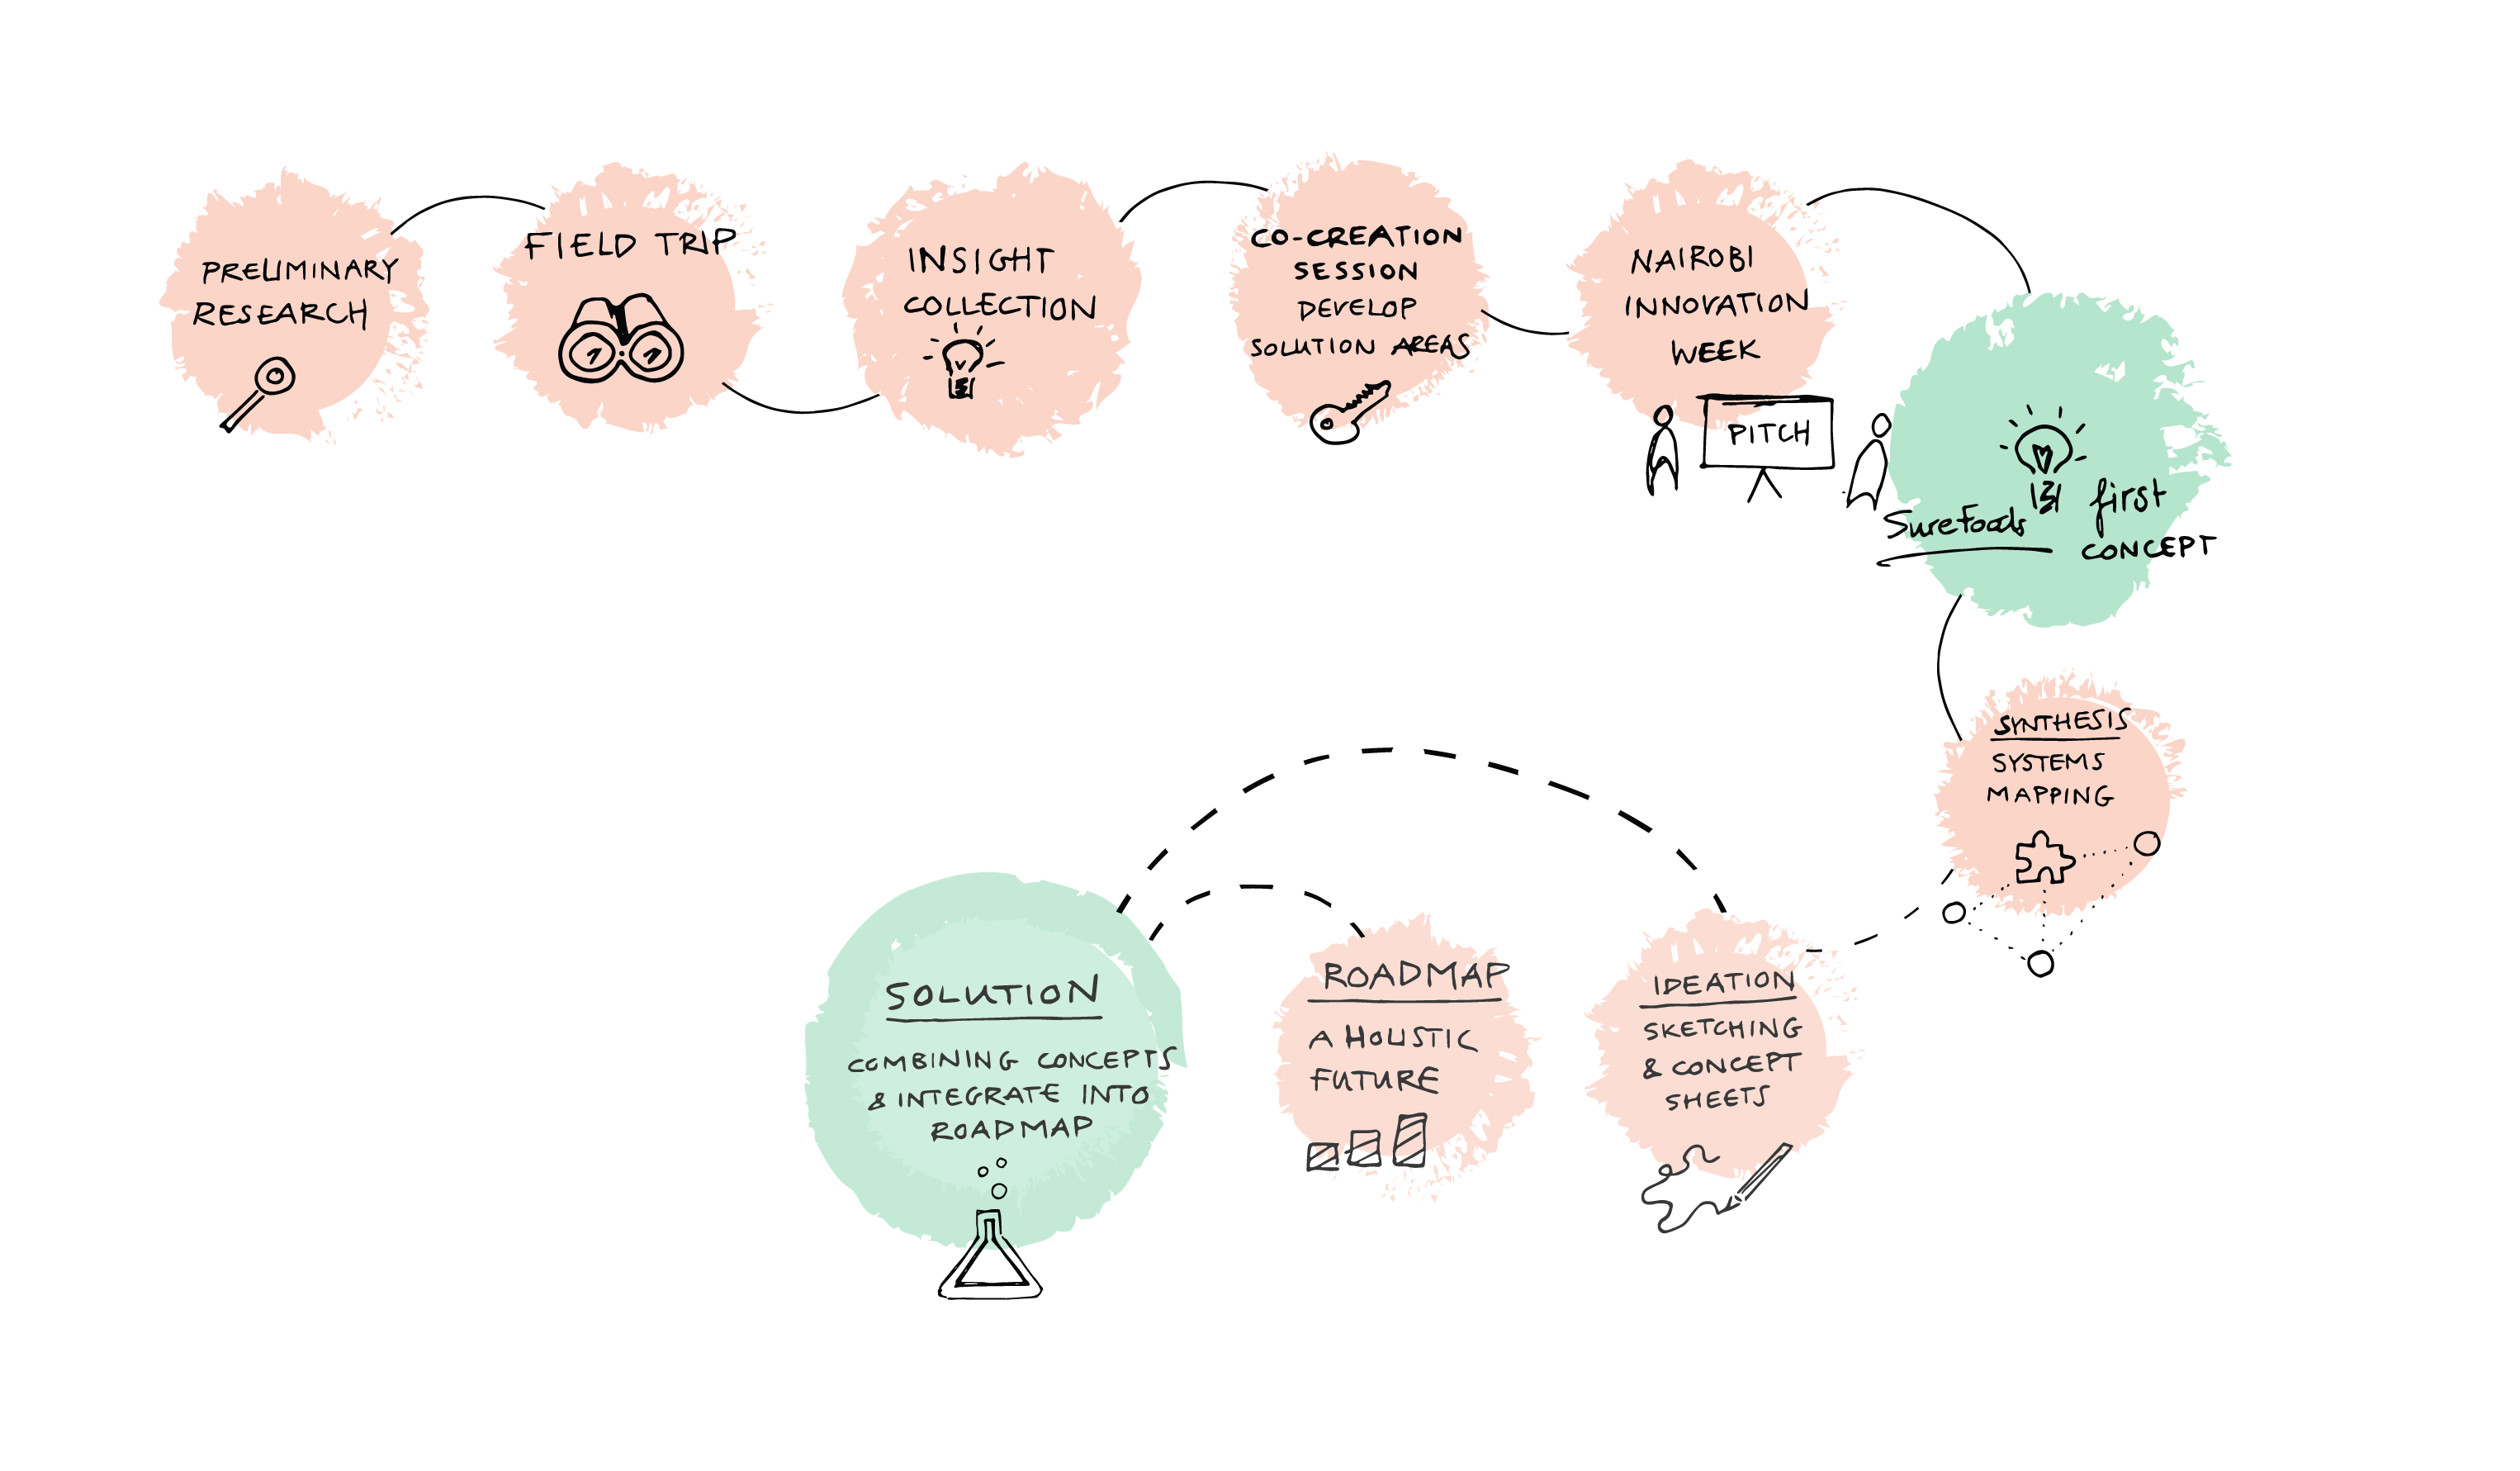
Process in brief:
-
- Sharing & processing insights on post-its
- Journey Mapping (for gathering, clustering & visualising insights)
- Recording & dividing all insights under larger themes
- System Mapping (for identifying the most fruitful leverage points for solutions)
- At all stages: extensive discussion using sketches, diagrams & other methods to communicate our ideas to other team members
Context:
At the stage of analysis & synthesis, our aim was to identify problems, collecting information extensively with qualitative and freedom research, structuring the data, analysing it, and connecting and dozing. It was important for us to gather all the key insights in the sense that our team consisted of multidisciplinary team members who all have different perspectives. This is also the power of creating new solution. Also, due to the nature of design research, it is often an limited sample. In the case of small samples, when validity and reliability are questioned, it’s important to create structure for qualitative information obtained by research.
Structuring, relativating what looks new by research, incorporating it into a diagram, and conceptualising what it is new repeatedly. It is the process of “synthesis or integration”. For example, we may remember the famous speech which Steve Jobs made at the Stanford University graduation ceremony: “Become a person who can create new value by connecting dots”. Jobs studied calligraphy at school, but initially thought it was useless, but after several years he could connect the knowledge of calligraphy which became useful when making Macintosh at Apple. Synthesis is the power to connect this completely different element and element to create new value.
Methods & Tools:
The flows, methods & tools could not be pre-fixed, but rather we initiated the process we thought was best, then discussed and adjusted for more suitable ones. Because the issues we were tackling with are not only a user-centered problem but also massively complex in nature, there seemed to be no single best method or tool for creating the innovative solution. When reflecting back on what we have done, the following methods & tools were used for Analysis & Synthesis phase.
“Post-it-note” for outputting the key insights
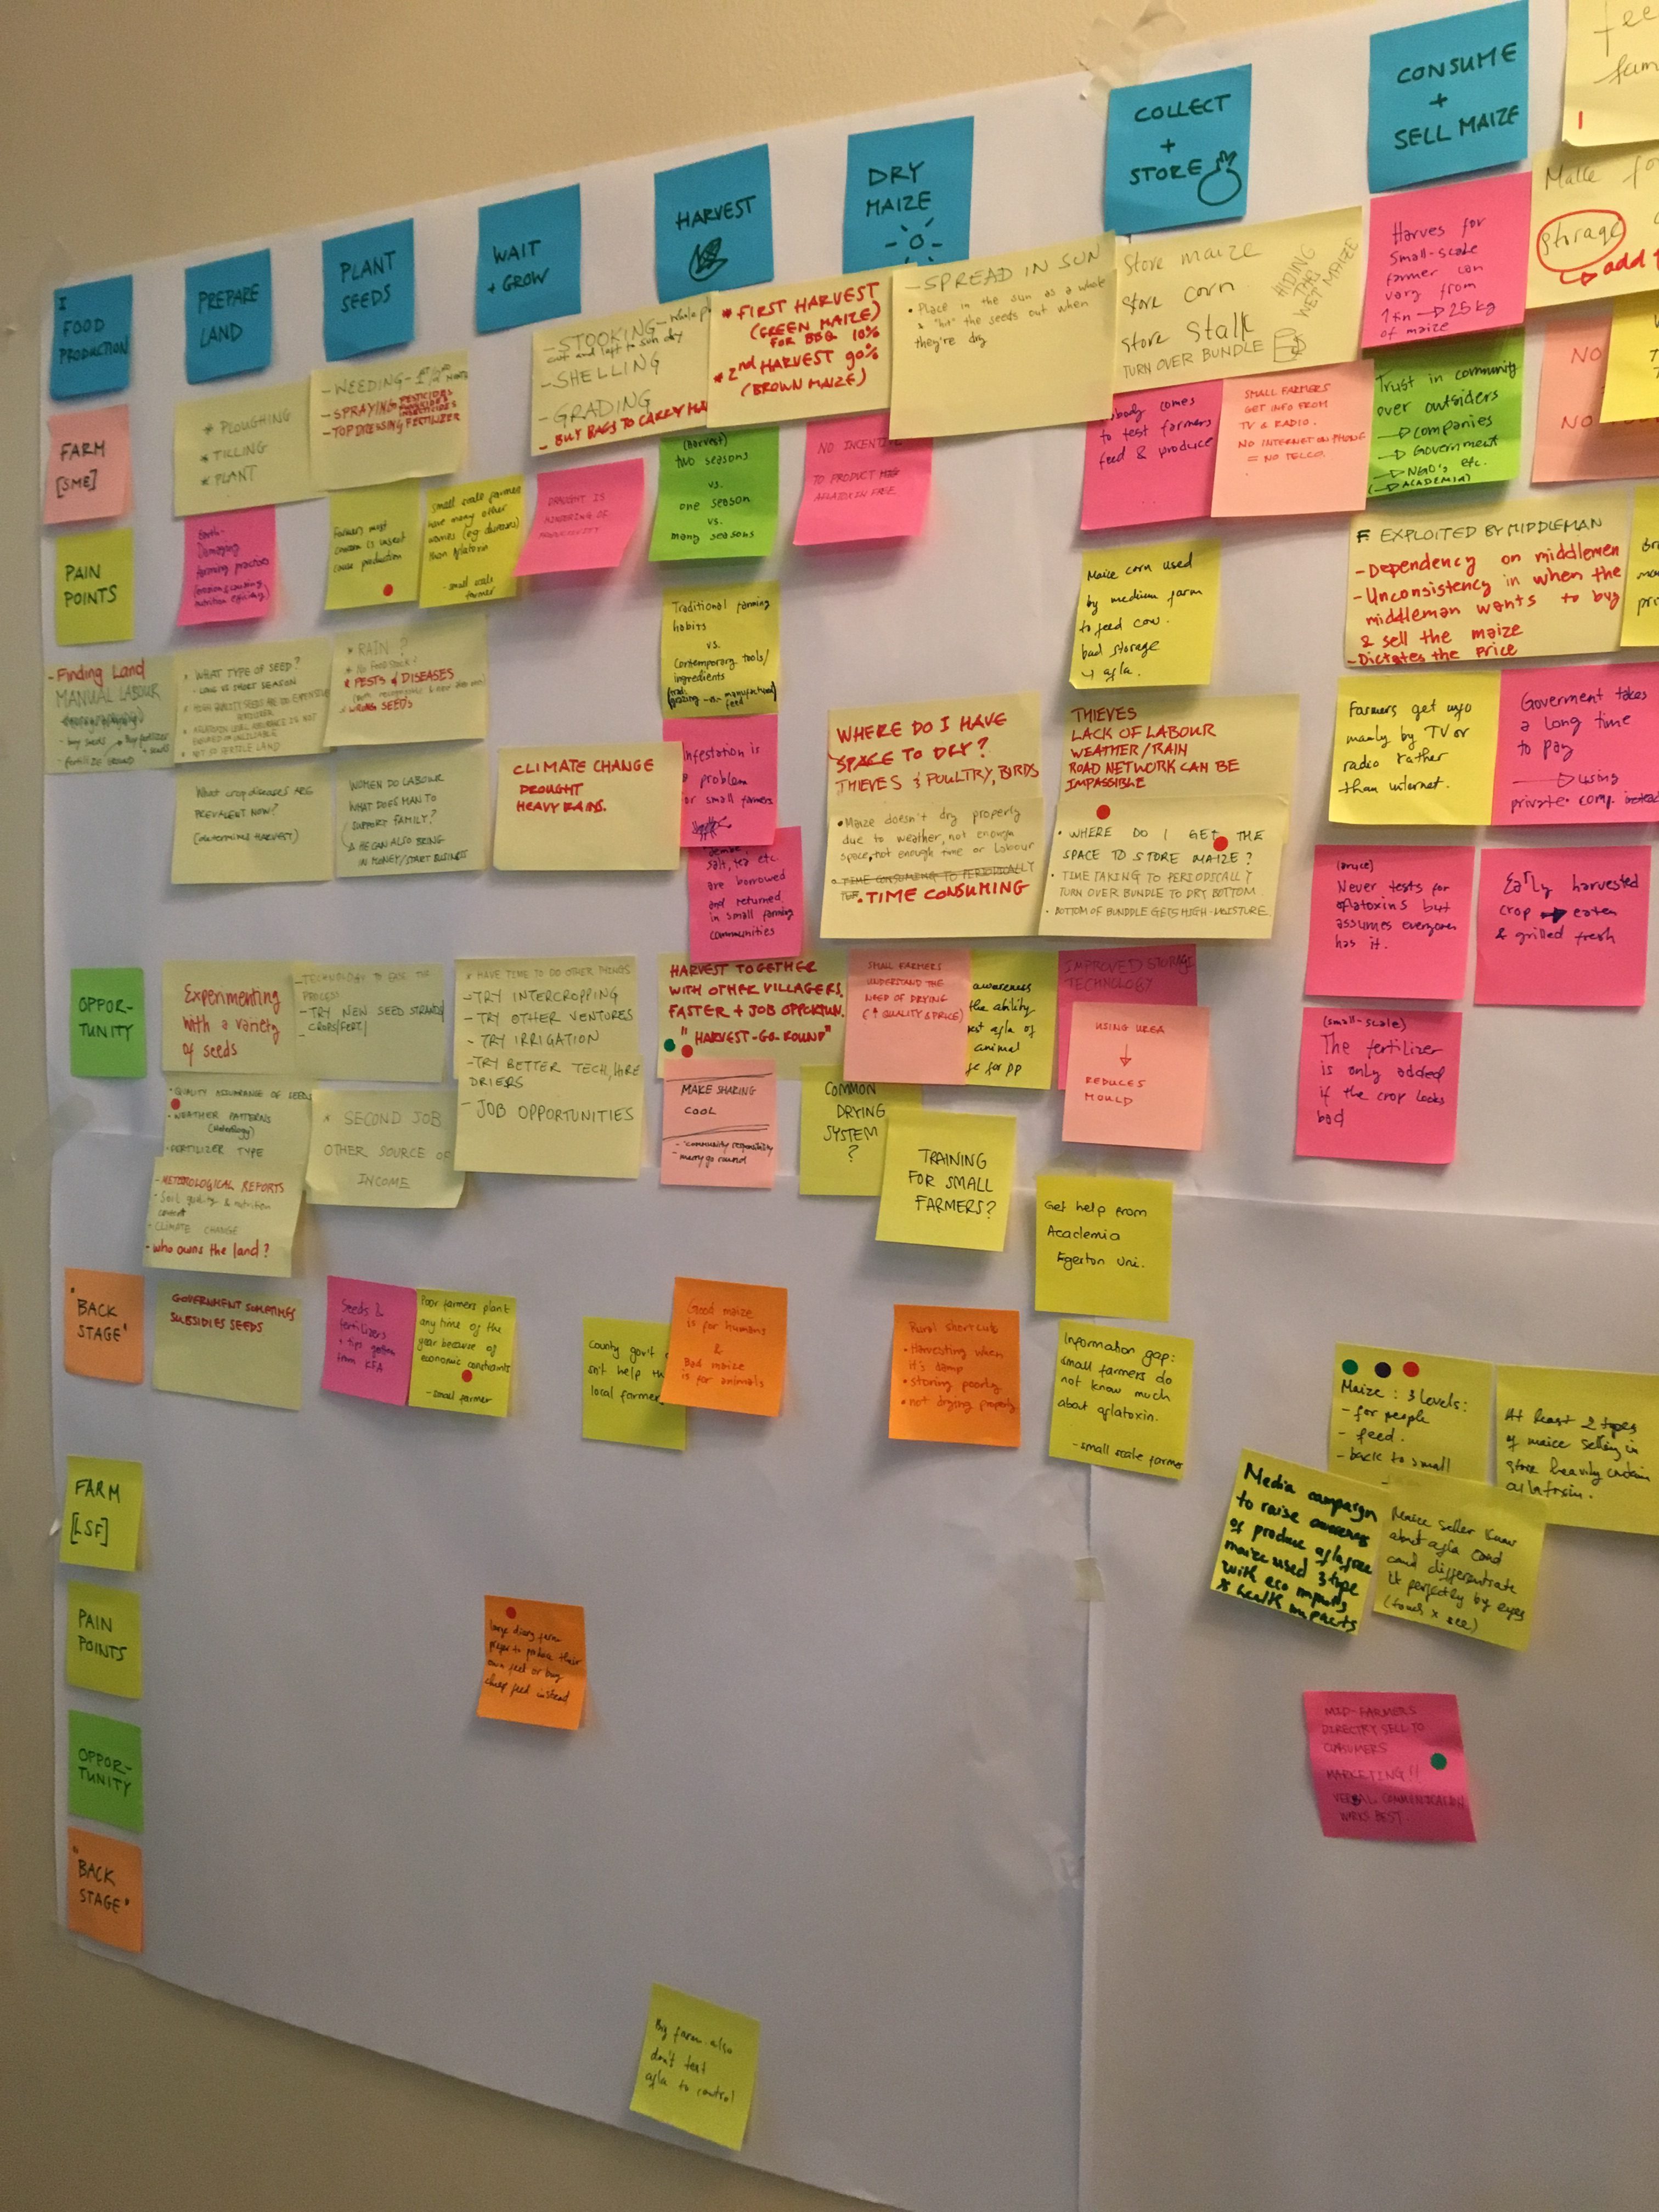
“Journey Mapping” for gathering, clustering and visualizing insights.
“System Mapping” for identifying the leverage point (solution area or focus point) where we could make the larger impact
“Apisnote” (https://www.apisnote.com/) which is the cloud post-it note application enabling all the participants to look, add and edit ideas simultaneously
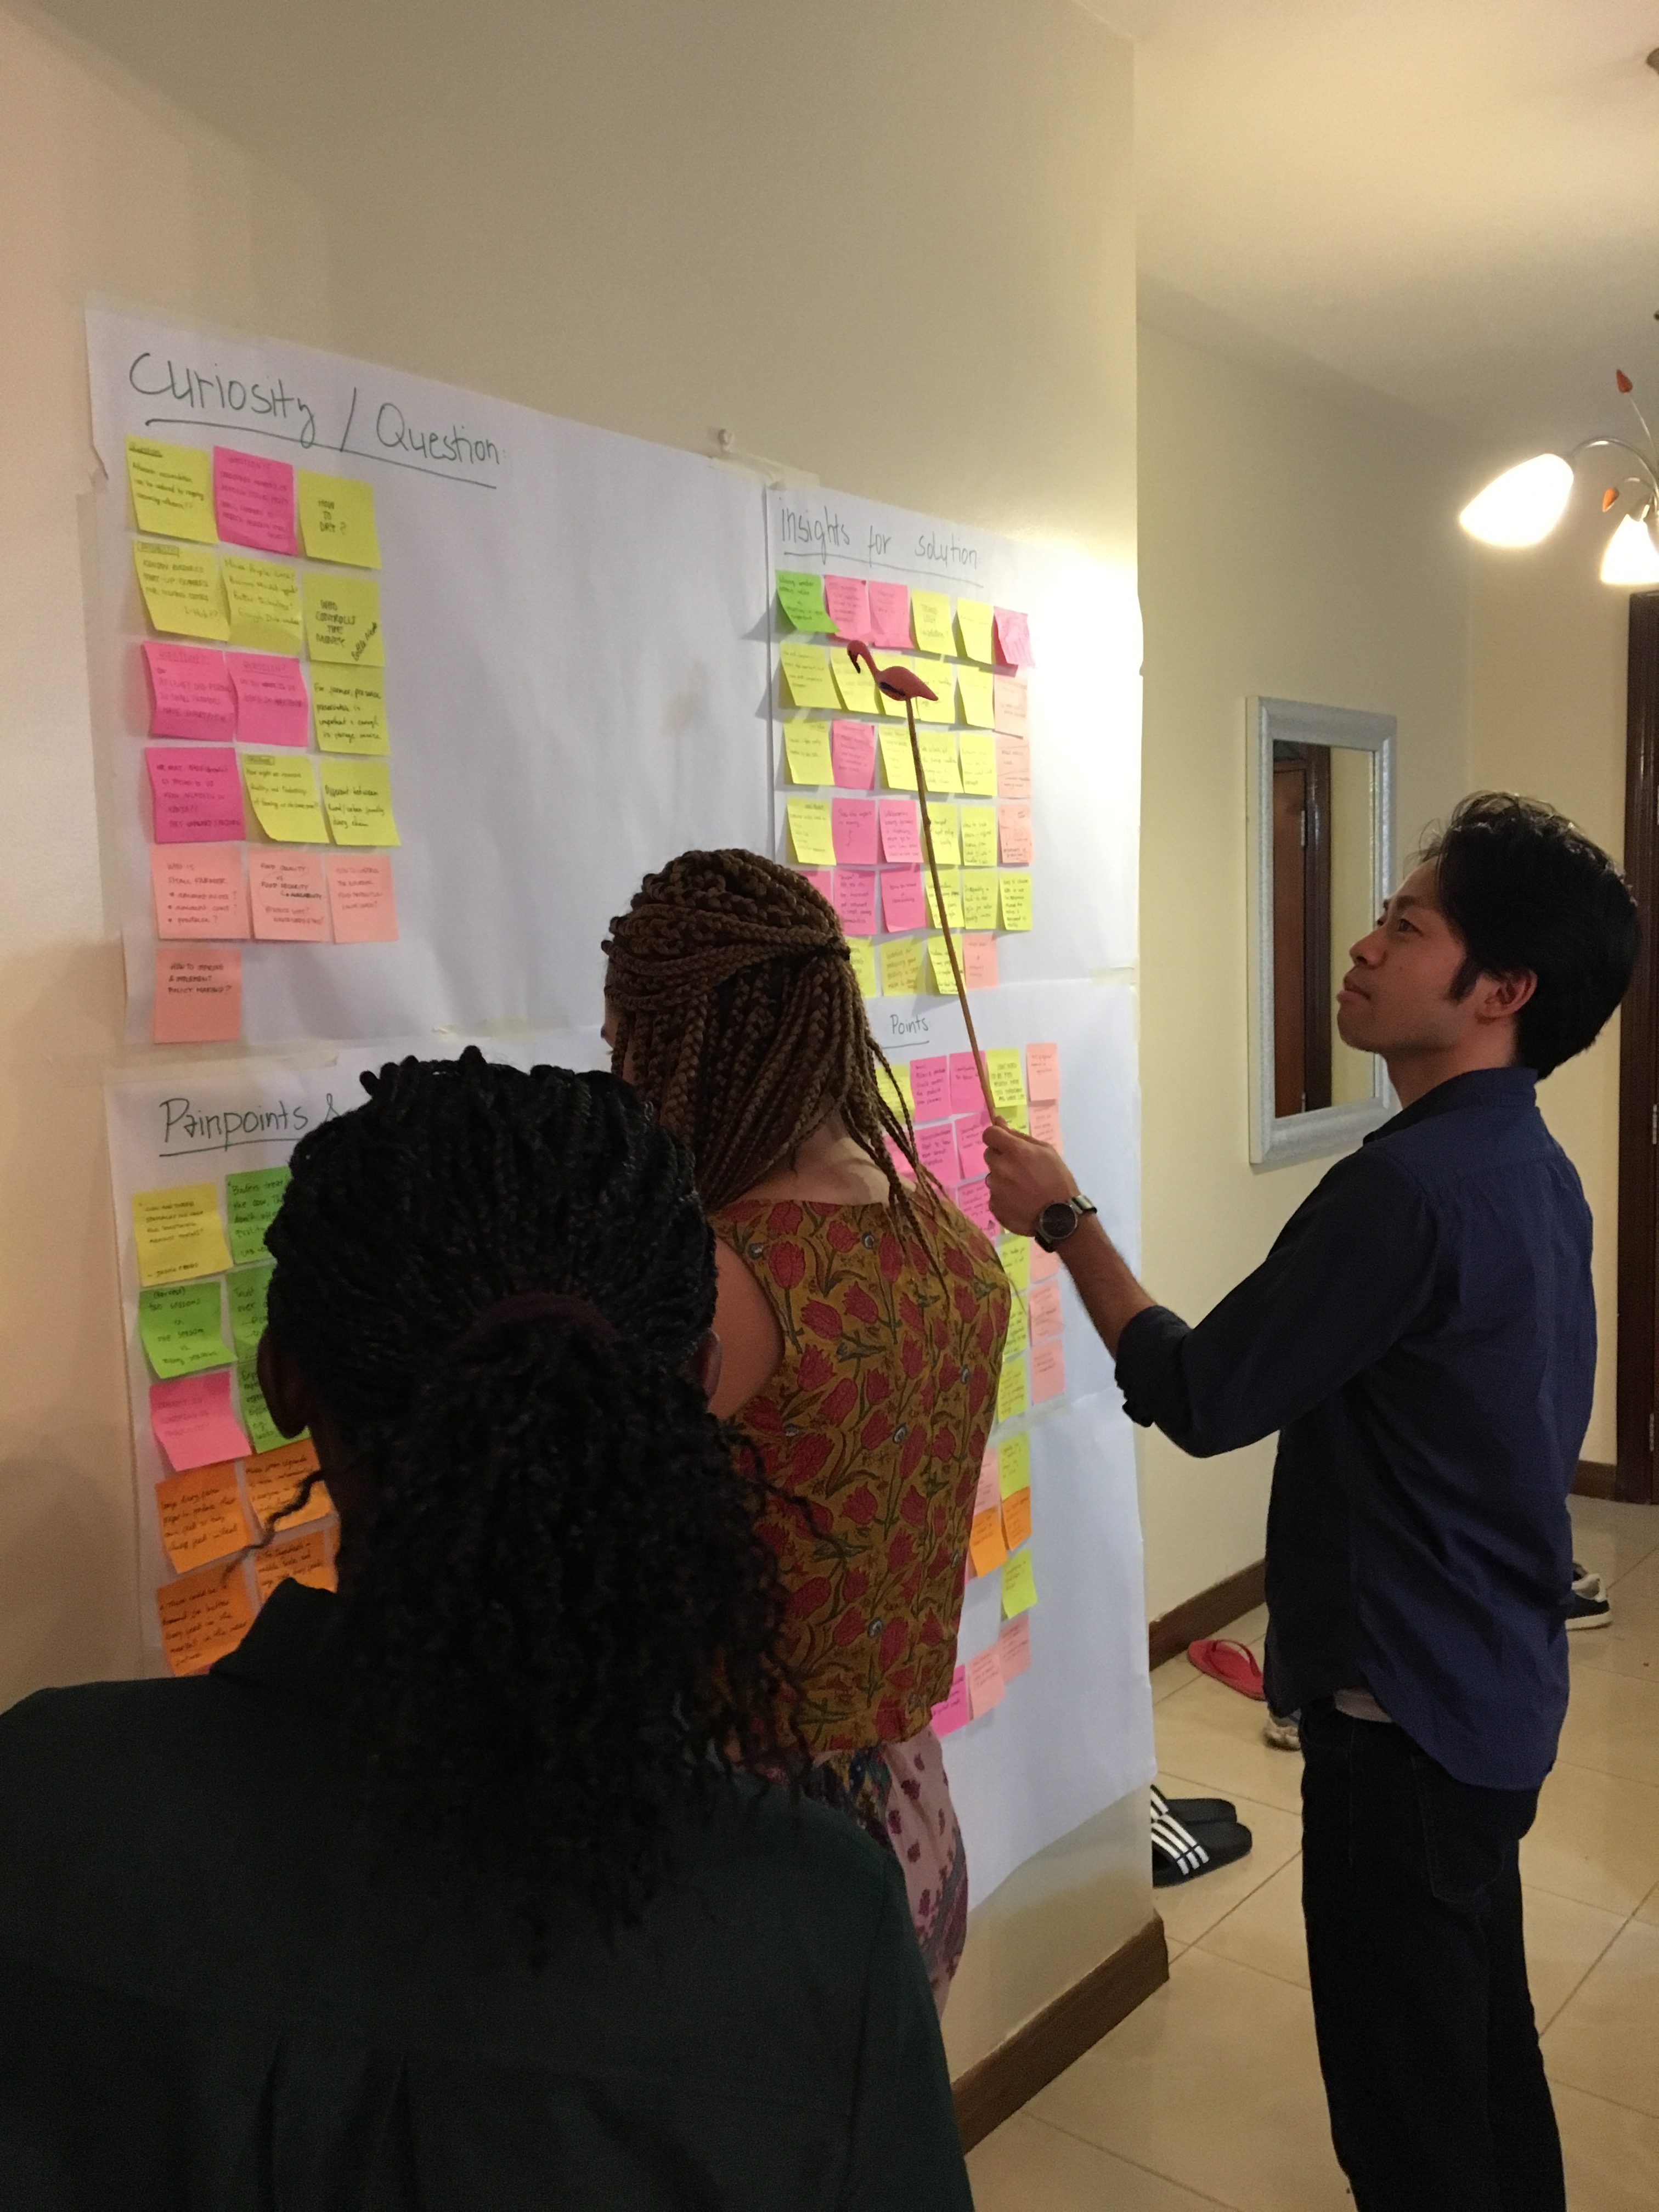
Insights Collection & Integration:
First process was that each member generate and output the individual insights we could have in our minds through the field trip by using Post-it Note. Then, we categorised the insights into the pain points, opportunities and the personnel curiosity or questions. These insights became a few hundred Post-it Notes, so those were summarised in the digital format using spreadsheet so that we could conveniently do grouping of these insights to understand the big picture of pain points and solution areas (See attachment at the end of the post for outcome).
One of the biggest challenges for us was to communicate, gather and integrate our ideas into the valuable insights that we could use for the next step; ideation. This was because we were joint initiative of 10 people and our Aalto University-University of Nairobi hybrid team was extensively diversified in terms of culture, expertise and ways of thinking. These team dynamics however, enabled us to conduct analysis & synthesis in the unique way to achieve the innovative solution in the end for this “complex” issue for sure.
(Follow the link below to discover our way of synthesis and analysis the data collection)
General Painpoints & Opportunities
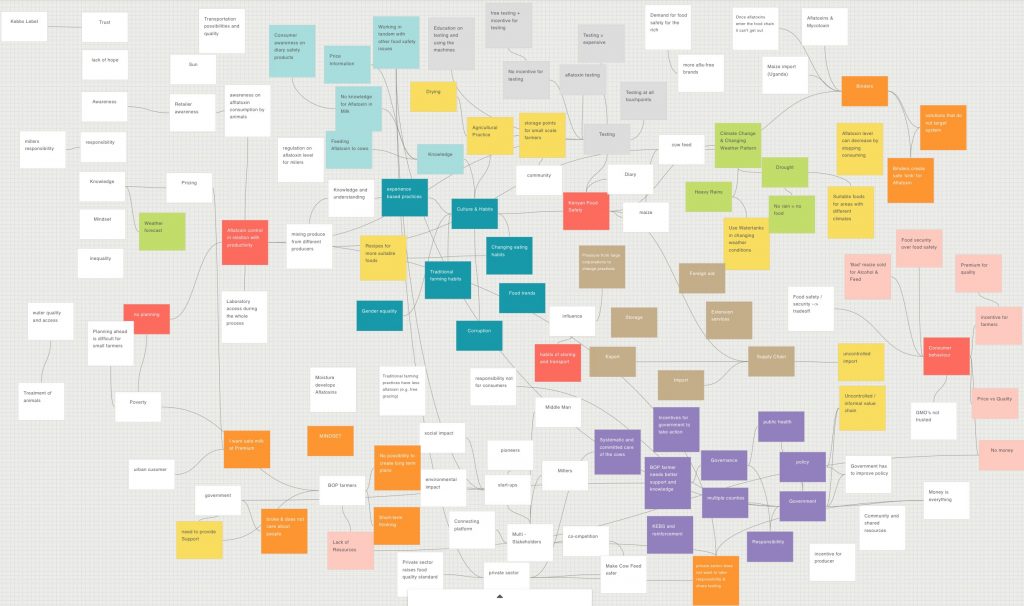
System Mapping:
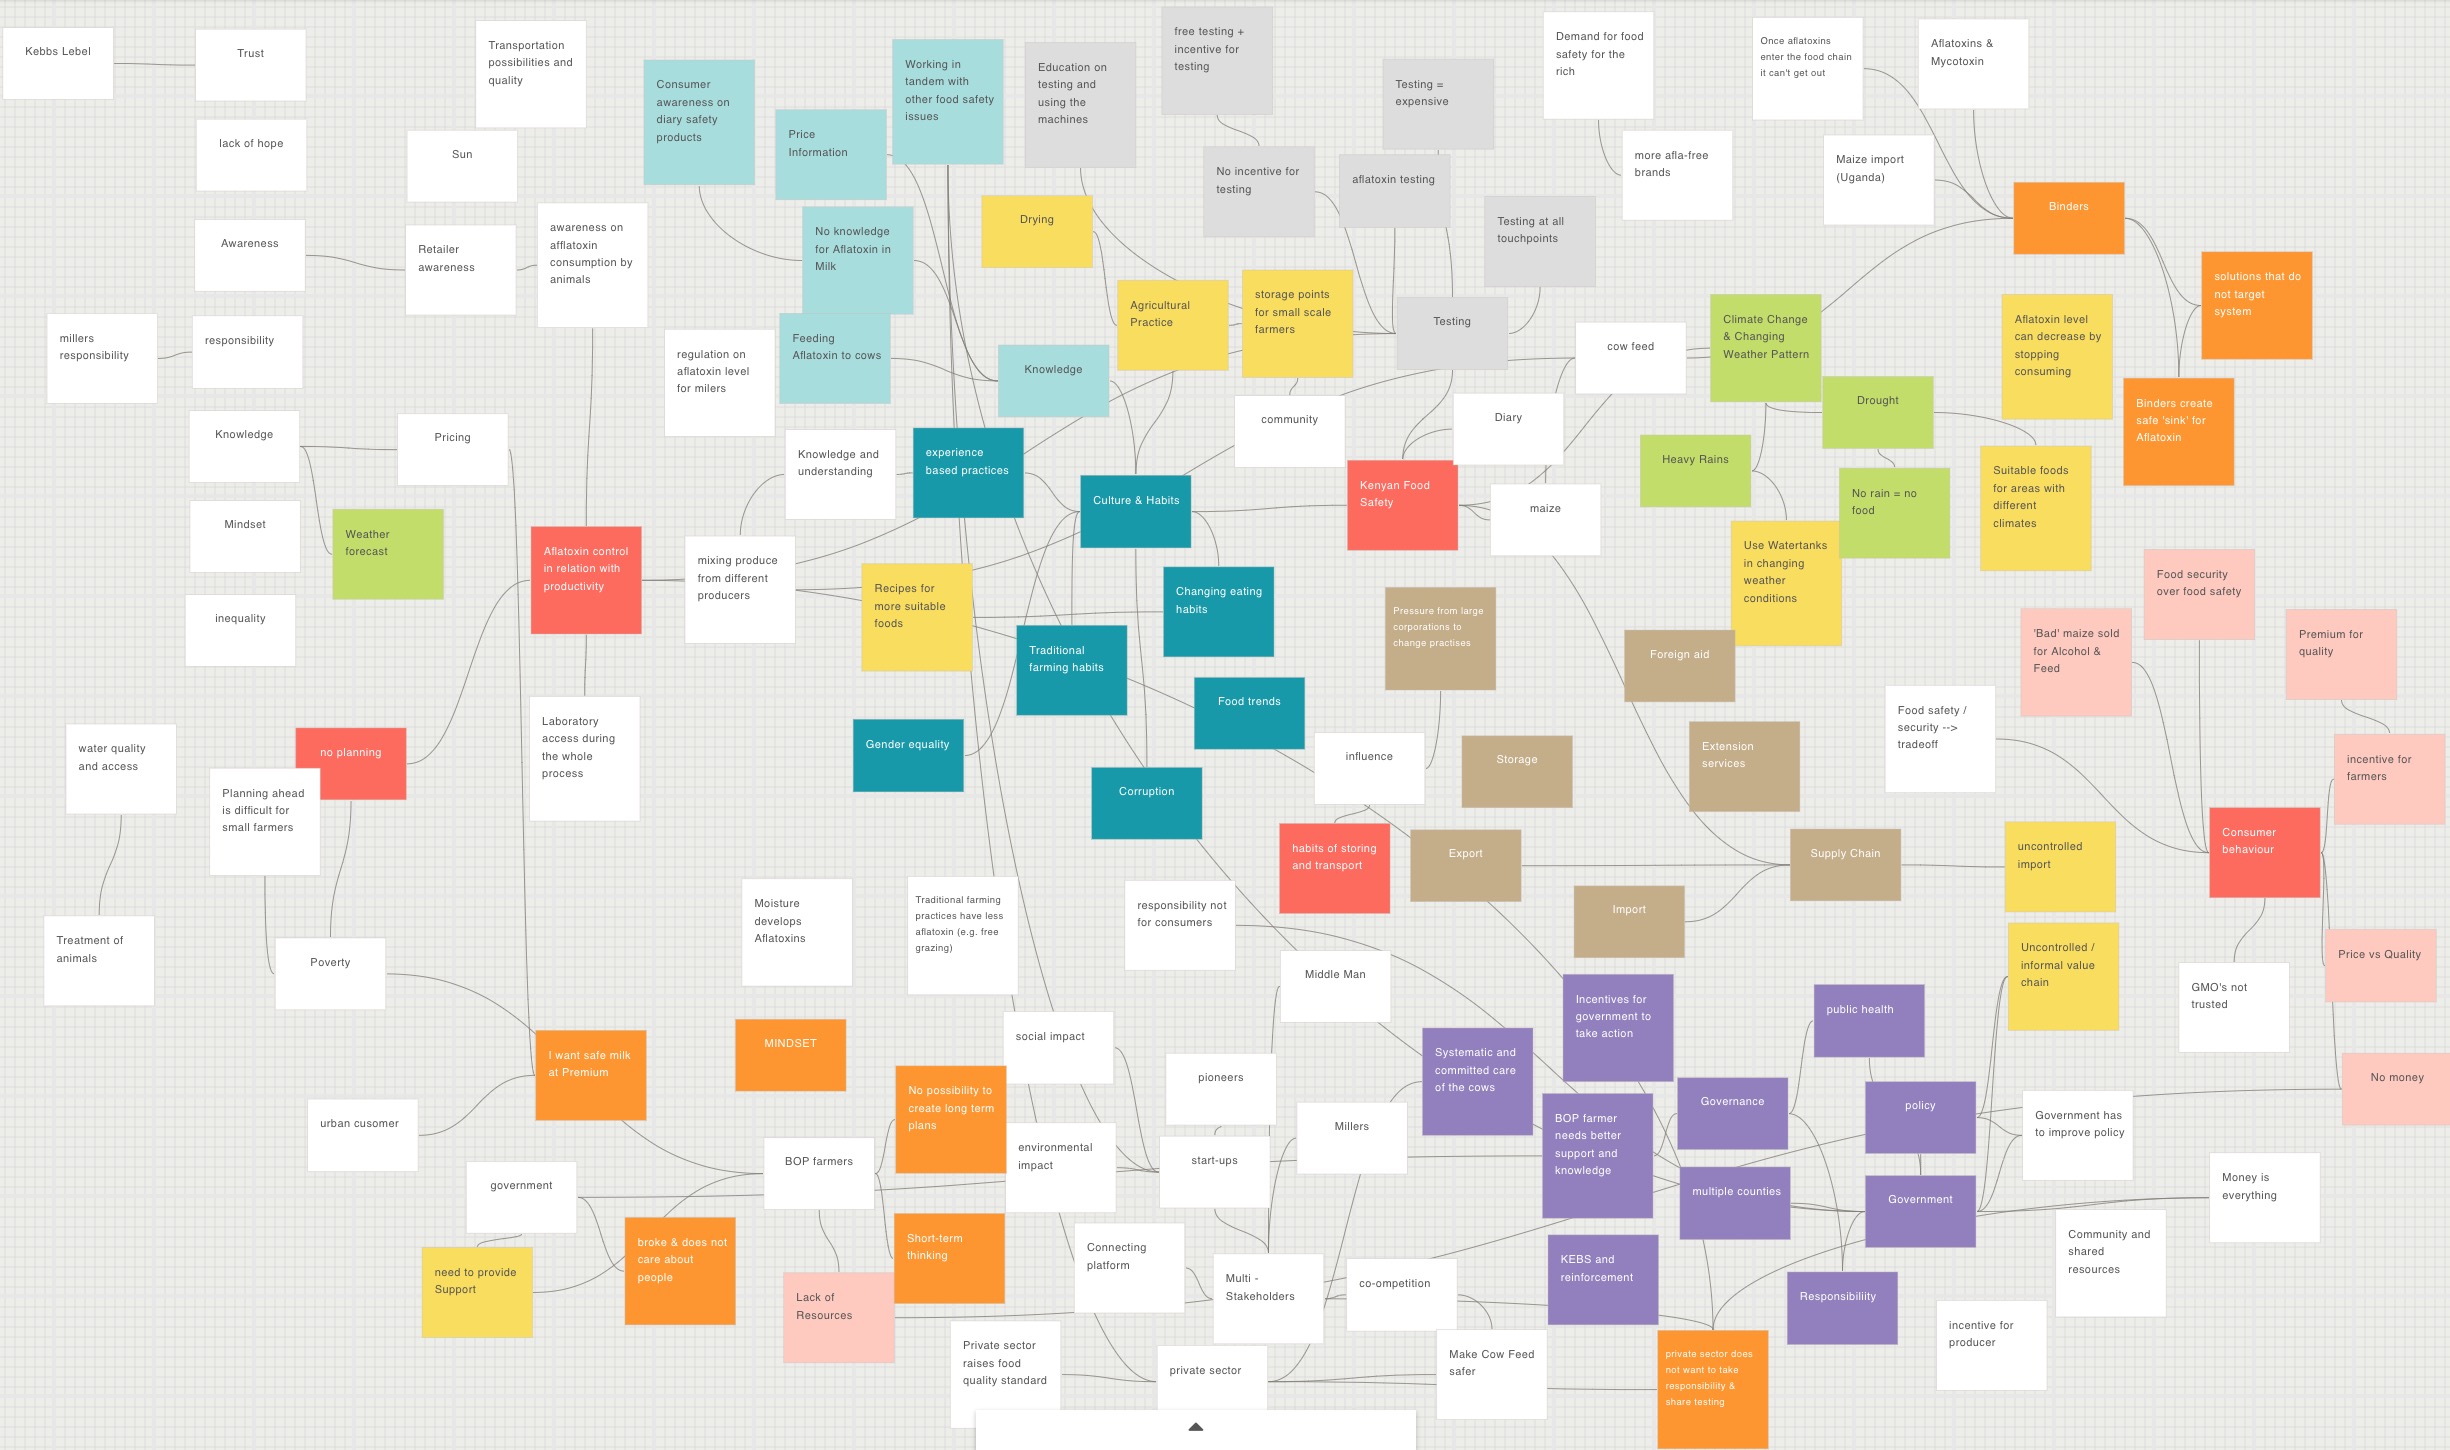
We could have the common overview of the big picture of our challenges through the insight collection, integration activities. However, what we could know was that the challenges and opportunities involved at least 12 areas that were overlapping. The overlap was on extensive and different levels all the way from the agricultural practices in the farmer level to climate change in the social level. So, our question became where we could start to tackle with the challenge? What were the most effective, biggest impact areas we could address.
We used the system thinking approach specifically using system mapping. System mapping is meant to be used to discover the dynamics and interconnectedness of complex systems at play. We started from generating the elements of ideas and insights in our minds, connecting the elements and discussing the areas which “pull the strings most strongly”. System mapping was more of a learning-by-doing activity exploring the leverage points (focus points for the bigger impact) rather than tools automatically generating the outcome by just doing. One of the key learnings here was to suspend the need to solve and embrace the chaos of the system. Relationships were messy, so the map was also a complex mess of data from different themes in nature.
These tools and processes lead us to ideation and concept development, which was the next step on our process.
The Process so far
The image below showcases the full process. Now we have just finished the Synthesis and are ready to do ideation and concept development, which you can read more about in here.